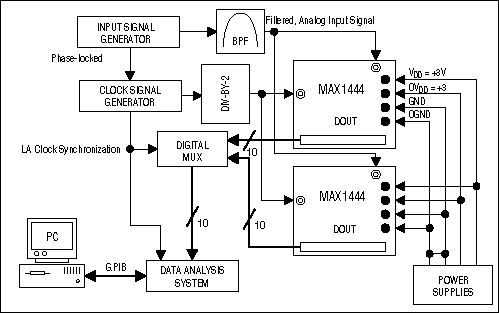
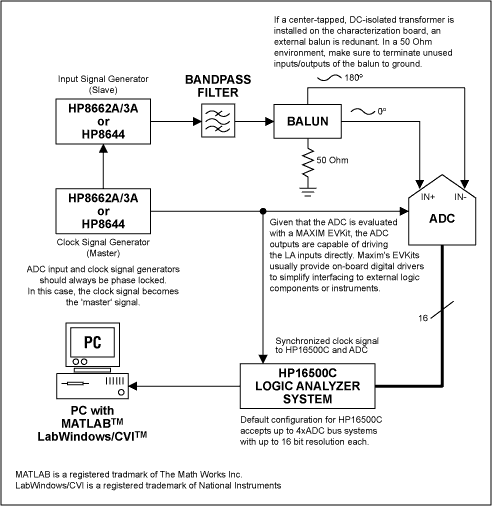
Abstract: One of the most useful techniques for evaluating the dynamic performance of fast and ultra-fast data converters is coherent sampling. This technique increases the spectral resolution of a Fast Fourier Transform (FFT) and eliminates the need for window sampling when certain conditions are met. However, if the conditions for coherent sampling cannot be met, window sampling can be used. The following application note compares coherent sampling with window sampling and provides an explanation of how to evaluate high-speed analog-to-digital converters (ADCs) using either method, while detailing the advantages and disadvantages of each.
ALSO SEE:
fIN / fSAMPLE = NWINDOW / NRECORD,
fIN: Periodic input signal
fSAMPLE: Sampling/clock frequency of the ADC under test
NWINDOW: Integer number of cycles1 within the sampling window
NRECORD: Number of data points in the sampling window or FFT
 Pic/2009-4/2009416163121861.gif">
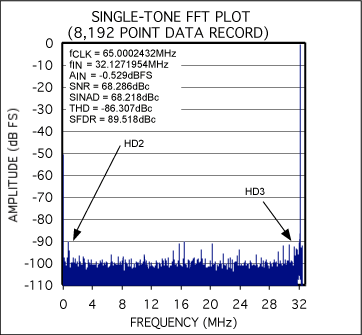
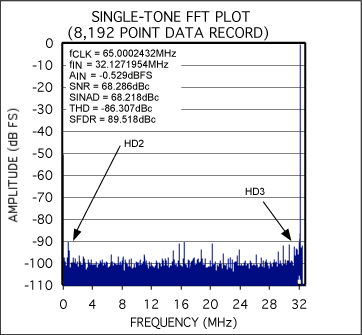
Figure 1. The results for a coherently sampled waveform. Given that NWINDOW/NRECORD is irreducible, and NRECORD is a power of 2, an odd number for NWINDOW will always produce an irreducible2 ratio in the FFT analysis.m The conditions for coherent sampling were met by choosing fIN = 25.0544433MHz, fSAMPLE = 82MHz, NRECORD = 8192, NWINDOW = 2503. The input test tone was computed by using a tone (25MHz) close to the desired frequency, calculating the resulting value for NWINDOW = fIN/fSAMPLE x NRECORD, and choosing a prime number (best choice to ensure an irreducibility) close to the calculated value for NWINDOW. The closest prime number in this case is 2503. With the prime number determined, the input frequency can be calculated by fIN = NWINDOW/NRECORD x fSAMPLE with NWINDOW representing the selected prime number.
Performing an FFT assumes that a waveform is continuously sampled from -∞ to +∞. If one of the above mentioned conditions for coherent sampling is not met, non-coherent sampling3 occurs. Unless window sampling ("windowing") -multiplying a sampled waveform by the mathematical expression describing the window- is used to compensate for waveform discontinuance4, spectral leakage is inevitable.

Figure 2. This FFT plot shows the effects of spectral leakage caused by non-coherent sampling. Although, the test conditions (fSAMPLE = 82MHz and NRECORD = 8192) were chosen to be identical with those in Figure 1, fIN was changed to 25.2245000MHz in Figure 2. Such a minor change in frequency offsets NWINDOW to an even number (2520), which clearly violates the rules for coherent sampling and causes spectral leakage.
Windowing the input data is equivalent to convolving the spectrum of the original signal with the spectrum of the window. Although it is often assumed that no window is used for coherent sampling, in actuality, the input signal is convolved with a rectangular-shaped window of uniform height.
The frequency characteristic of a window is a continuous spectrum consisting of a main lobe and several side lobes. The main lobe is centered at the frequency of the input signal. Side lobes approach zero progressing from each side of the main lobe. An FFT, on the other hand, produces a discrete frequency spectrum. The continuous, periodic spectrum of a window is sampled by the FFT, just as an ADC would sample an input signal in the time domain. What appears in each frequency line of the FFT is the value of the continuous convolved spectrum at each FFT frequency component.
If the frequency components of the original signal match a frequency line exactly, as is the case when acquiring an integer number of cycles, only the main lobe of the spectrum can be seen. Side-lobes will not appear since the window spectrum approaches zero at bin-frequency intervals on either side of the main lobe. If a time record does not contain an integer number of cycles, the continuous spectrum of the window is shifted from the main lobe center by a fraction of the frequency bin. This corresponds to the difference between the frequency component and the frequency lines in the FFT spectrum. This shift causes side-lobes to appear in the spectrum. Therefore, the side-lobe characteristics of a given window directly affect the extent to which adjacent frequency components "leak into" neighboring frequency bins.
Table 1.
Different windows support different applications, and choosing the right one is not an easy task. Given that the signal contains strong interfering frequency components distant from the frequency of interest, a window with a high roll-off rate (e.g., a Hanning window) for the side-lobes should be chosen. However, if strong interfering signals are close to the frequency of interest, a window with a rather small maximum side-lobe level (e.g., a Flat Top window) is the more suitable choice. A waveform with adjacent components of identical magnitude is analyzed best when left within a rectangular window or no window at all. For a single-tone test in which the focus is on amplitude accuracy rather than its precise location in the frequency bin, a window with a wide main lobe (e.g., a Blackman window) is recommended.

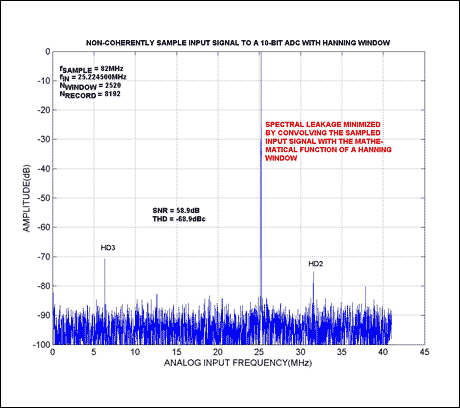
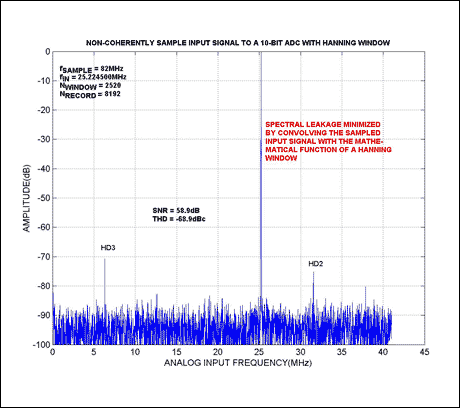
Figure 3. "Improved" FFT plot for a non-coherently sampled input signal (for test conditions, see Figure 2) convolved with a Hanning window.
Notes:
ALSO SEE:
- Application Note: Coherent Sampling Calculator (CSC)
- Coherent Sampling Calculator (XLS, 81K)
What Defines Coherent Sampling?
Coherent sampling describes the sampling of a periodic signal, where an integer number of its cycles fit into a predefined sampling window. Mathematically, this can be expressed as:fIN / fSAMPLE = NWINDOW / NRECORD,
fIN: Periodic input signal
fSAMPLE: Sampling/clock frequency of the ADC under test
NWINDOW: Integer number of cycles1 within the sampling window
NRECORD: Number of data points in the sampling window or FFT
Figure 1. The results for a coherently sampled waveform. Given that NWINDOW/NRECORD is irreducible, and NRECORD is a power of 2, an odd number for NWINDOW will always produce an irreducible2 ratio in the FFT analysis.m The conditions for coherent sampling were met by choosing fIN = 25.0544433MHz, fSAMPLE = 82MHz, NRECORD = 8192, NWINDOW = 2503. The input test tone was computed by using a tone (25MHz) close to the desired frequency, calculating the resulting value for NWINDOW = fIN/fSAMPLE x NRECORD, and choosing a prime number (best choice to ensure an irreducibility) close to the calculated value for NWINDOW. The closest prime number in this case is 2503. With the prime number determined, the input frequency can be calculated by fIN = NWINDOW/NRECORD x fSAMPLE with NWINDOW representing the selected prime number.
Performing an FFT assumes that a waveform is continuously sampled from -∞ to +∞. If one of the above mentioned conditions for coherent sampling is not met, non-coherent sampling3 occurs. Unless window sampling ("windowing") -multiplying a sampled waveform by the mathematical expression describing the window- is used to compensate for waveform discontinuance4, spectral leakage is inevitable.

Figure 2. This FFT plot shows the effects of spectral leakage caused by non-coherent sampling. Although, the test conditions (fSAMPLE = 82MHz and NRECORD = 8192) were chosen to be identical with those in Figure 1, fIN was changed to 25.2245000MHz in Figure 2. Such a minor change in frequency offsets NWINDOW to an even number (2520), which clearly violates the rules for coherent sampling and causes spectral leakage.
Spectral Leakage and Windowing
When the input signal does not entirely fit into the defined sample window, synchronous sampling of the input signal can be used to eliminate spectral leakage problems that would otherwise ensue. Spectral leakage distorts the digitized result by spreading the energy of any given frequency component across adjacent frequency bins (the size of each frequency bin = fSAMPLE/NRECORD). Using windowing, and selecting an appropriately sized window, minimizes the effects of spectral leakage.Windowing the input data is equivalent to convolving the spectrum of the original signal with the spectrum of the window. Although it is often assumed that no window is used for coherent sampling, in actuality, the input signal is convolved with a rectangular-shaped window of uniform height.
The frequency characteristic of a window is a continuous spectrum consisting of a main lobe and several side lobes. The main lobe is centered at the frequency of the input signal. Side lobes approach zero progressing from each side of the main lobe. An FFT, on the other hand, produces a discrete frequency spectrum. The continuous, periodic spectrum of a window is sampled by the FFT, just as an ADC would sample an input signal in the time domain. What appears in each frequency line of the FFT is the value of the continuous convolved spectrum at each FFT frequency component.
If the frequency components of the original signal match a frequency line exactly, as is the case when acquiring an integer number of cycles, only the main lobe of the spectrum can be seen. Side-lobes will not appear since the window spectrum approaches zero at bin-frequency intervals on either side of the main lobe. If a time record does not contain an integer number of cycles, the continuous spectrum of the window is shifted from the main lobe center by a fraction of the frequency bin. This corresponds to the difference between the frequency component and the frequency lines in the FFT spectrum. This shift causes side-lobes to appear in the spectrum. Therefore, the side-lobe characteristics of a given window directly affect the extent to which adjacent frequency components "leak into" neighboring frequency bins.
Window Characteristics and Window Selection
Before choosing the appropriate window, it is necessary to define the parameters that enable users to compare windows (Table 1). Such characteristics include a window's -3dB and -6dB main-lobe widths, the maximum side-lobe amplitude, and the side-lobe roll-off rate. Side lobes of a given window are identified by two main characteristics:- The largest side-lobe level in decibels, with respect to the main lobe peak.
- Side-lobe roll-off, which is defined as the asymptotic decay rate of the side-lobe peaks.
Table 1.
| Window Type | -3dB Main-Lobe Width | -6dB Main-Lobe Width | Maximum Side-Lobe Level | Side-Lobe Roll-Off Rate |
| No Window (Rectangular) | 0.89 bins | 1.21 bins | -13.2dB | 20dB/decade 6dB/octave |
| Hamming | 1.3 bins | 1.81 bins | -41.9dB | 20dB/decade 6dB/octave |
| Hanning | 1.44 bins | 2 bins | -31.6dB | 60dB/decade 18dB/octave |
| Blackman | 1.68 bins | 2.35 bins | -58dB | 60dB/decade 18dB/octave |
Different windows support different applications, and choosing the right one is not an easy task. Given that the signal contains strong interfering frequency components distant from the frequency of interest, a window with a high roll-off rate (e.g., a Hanning window) for the side-lobes should be chosen. However, if strong interfering signals are close to the frequency of interest, a window with a rather small maximum side-lobe level (e.g., a Flat Top window) is the more suitable choice. A waveform with adjacent components of identical magnitude is analyzed best when left within a rectangular window or no window at all. For a single-tone test in which the focus is on amplitude accuracy rather than its precise location in the frequency bin, a window with a wide main lobe (e.g., a Blackman window) is recommended.

Figure 3. "Improved" FFT plot for a non-coherently sampled input signal (for test conditions, see Figure 2) convolved with a Hanning window.
Conclusion
By looking at the previously mentioned examples, it is clear that choosing an appropriate window function for a given application/waveform is indeed difficult. Depending on application, signal content, FFT spectrum components and characteristics of interest, the choice of window will always be a compromise between spectral leakage minimization, frequency/amplitude precision, side-lobe reduction, and main-lobe width increase.Notes:
- NWINDOW must be a power of 2 to allow the use of a radix
- FFT analysis.
- An irreducible ratio ensures identical code sequences not to be repeated multiple times. Unnecessary repetition of the same code is not desirable as it increases ADC test time.
- ADCs are usually characterized for and tested with sinusoidal input signals. Non-coherent sampling for sinusoidal input signals means that the first and the last sample of the input sinusoid are discontinuous with one another.
- Waveform discontinuance describes an input signal, for which an integer number of its cycles do not fit into a predefined window.
 电子发烧友App










评论