不同领域的数据科学家使用聚类方法在他们的数据集中找到自然的“相似”观察组。流行的聚类方法可以是:
基于质心的:根据与某个质心的接近程度将点分组为 k 组。
基于图形的:根据图中顶点的连接对其进行分组。
Density-based:根据附近区域数据的密度或稀疏性更灵活地分组。
基于层次密度的应用程序空间聚类 w / Noise (HDBSCAN)算法是一种density-based聚类方法,对噪声具有鲁棒性(将稀疏区域中的点作为簇边界,并将其中一些点直接标记为噪声)。基于密度的聚类方法,如 HDBSCAN ,能够发现形状奇特、大小各异的聚类 — 与k-means、k-medioids或高斯混合模型等基于质心的聚类方法截然不同,这些方法找到一组 k 个质心,将簇建模为固定形状和大小的球。除了必须预先指定 k 之外,基于质心的算法的性能和简单性帮助它们仍然是高维聚类点的最流行方法之一;即使在不修改输入数据点的情况下,它们也无法对不同大小、形状或密度的簇进行建模。
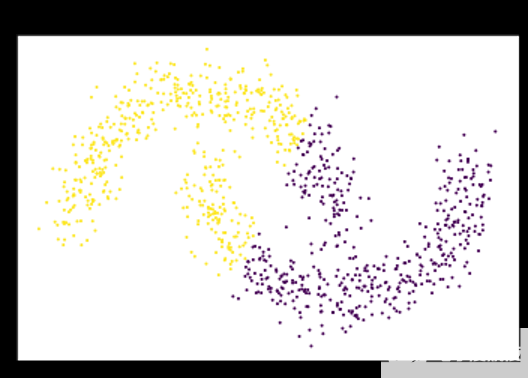
图 1 : K-means 假设数据可以用固定大小的高斯球建模,并切割卫星,而不是单独聚类。 K-means 将每个点指定给一个簇,即使存在噪声和异常值也会影响结果的质心s.
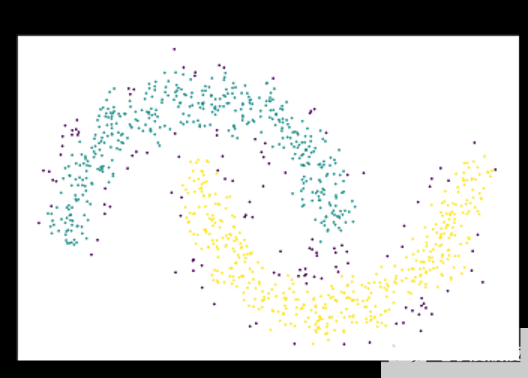
图 2 :基于密度的算法通过从密集区域的突出邻域扩展簇来解决此问题。 DBSCAN 和 HDBSCAN 可以将这些点解释为噪声,并将其标记为噪声,如图中的紫色点。
HDBSCAN 建立在一种众所周知的基于密度的聚类算法 DBSCAN 的基础上,该算法不要求提前知道簇的数量,但仍然存在一个不幸的缺点,即假设簇可以用一个全局密度阈值建模。这使得对具有不同密度的簇进行建模变得困难。 HDBSCAN 改进了这一缺点,通过使用单链聚簇来构建树状图,从而可以找到不同密度的簇。另一种著名的基于密度的聚类方法称为光学算法,它改进了 DBSCAN ,并使用分层聚类来发现密度不同的聚类。光学技术通过将点投影到一个新的空间(称为可达空间)来改进标准的单链接聚类,该空间将噪声从密集区域进一步移开,使其更易于处理。然而,与许多其他层次聚集聚类方法(如单链接聚类和完全链接聚类)一样, OPTICS 也存在以单个全局切割值切割生成的树状图的缺点。 HDBSCAN 本质上是光学+ DBSCAN ,引入了集群稳定性的度量,以在不同级别上切割树状图。
我们将通过快速示例演示 HDBSCAN 的 RAPIDS cuML 实现中当前支持的功能,并将提供我们在 GPU 上实现的一些实际示例和基准。在阅读了这篇博文之后,我们希望您对 RAPIDS ‘ GPU – 加速 HDBSCAN 实施可以为您的工作流和探索性数据分析过程带来的好处感到兴奋。
RAPIDS 中的 HDBSCAN 入门
GPU 提供了一组 RAPIDS – 加速 CPU 库,几乎可以替代 PyData 生态系统中许多流行的库。下面的示例笔记本演示了 Python 上使用最广泛的 HDBSCAN Python 库与 GPU 上的 RAPIDS cuML HDBSCAN 之间的 API 兼容性(扰流板警报–在许多情况下,它与更改导入一样简单)。
Basic Usage
Example of training an HDBSCAN model using the hdbscan Python package in Scikit-learn contrib:
from sklearn import datasets
from hdbscan import HDBSCAN

X, y = datasets.make_moons(n_samples=50, noise=0.05)

model = HDBSCAN(min_samples=5)
y_hat = model.fit_predict(X)
from sklearn import datasets
from cuml.cluster import HDBSCAN

X, y = datasets.make_moons(n_samples=50, noise=0.05)

model = HDBSCAN(min_samples=5, gen_min_span_tree=True)
y_hat = model.fit_predict(X)
/share/workspace/cuml/python/cuml/internals/api_decorators.py:794: FutureWarning: Pass handle=None, verbose=False, output_type=None as keyword args. From version 21.06, passing these as positional arguments will result in an error
  return func(**kwargs)
Plotting
We can plot the minimum spanning tree the same way we would for the original HDBSCAN implementation:
model.minimum_spanning_tree_.plot()
The single linkage dendrogram and condensed tree can be plotted as well:
model.single_linkage_tree_.plot()
model.condensed_tree_.plot()
下面是一个非常简单的示例,演示了基于密度的聚类优于基于质心的技术对某些类型数据的好处,以及使用 HDBSCAN 优于 DBSCAN 的好处。
Clustering Algorithm Comparison
Example notebook showing the strengths of density-based clustering techniques DBSCAN & HDBSCAN on datasets with odd and interleaved shapes.
Generate the data
from sklearn import datasets
import numpy as np
import warnings
warnings.filterwarnings("ignore")
X, y = datasets.make_moons(n_samples=1000, noise=0.12)
import matplotlib.pyplot as plt
plt.scatter(X[:,0], X[:,1], c=y, s=0.5)
K-Means
Even when we know there are only 2 clusters in this dataset, we can see that k-means just separates the space into two evenly-sized regions. It's not possible to model the interleaved and odd cluster shapes without performing some heavy pre-processing to project the points into a space where they can be modeled with fixed-sized balls.
from cuml.cluster import KMeans
kmeans_labels_ = KMeans(n_clusters=2).fit_predict(X)
plt.title("Interleaved Moons w/ K-Means")
plt.xticks([])
plt.yticks([])
plt.scatter(X[:,0], X[:,1], c=kmeans_labels_, s=1.0)
DBSCAN
While this particular example dataset tends to be a great demonstration of how DBSCAN can find clusters of odd shapes and similar densities, theepsparameter sets the radius of a ball around each point where points inside the ball are considered part of its neighborhood. This neighborhood is called an epsilon neighborhoods and it can be pretty non-intuitive to tune in practice. In addition, it's assumed that the sameepssetting applies globally to all the data points. A little bit more intuitive is themin_samplesparameter, which determines the neighborhood size within theepsball for a point to be considered acore point, upon which its neighborhood will be expanded to form a cluster.
from cuml.cluster import DBSCAN
As we can see, the default paramter settings of DBSCAN (and other density-based algorithms) make assumptions about the data that won't often lead to good clustering results.
dbscan_labels_ = DBSCAN().fit_predict(X)
plt.scatter(X[:,0], X[:,1], c=dbscan_labels_, s=1.0)
We can set themin_samplesparameter to 10, but the amount of noise is too high for this alone to result in good cluster assignments.
dbscan_labels_ = DBSCAN(min_samples=10).fit_predict(X)
import numpy as np
np.unique(dbscan_labels_)
array([0], dtype=int32)
plt.scatter(X[:,0], X[:,1], c=dbscan_labels_, s=0.5)
We can introduce a setting for theepsparameter, but it's unclear how to determine a good setting for this value just from this visualization. Setting this value too small can yield too many small clusterings which are not representative of the larger patterns in the data.
dbscan_labels_ = DBSCAN(min_samples=10, eps=0.08).fit_predict(X)
np.unique(dbscan_labels_)
array([-1,  0,  1,  2,  3,  4,  5,  6,  7,  8,  9, 10, 11, 12, 13, 14, 15,
       16, 17, 18, 19, 20], dtype=int32)
Increasingepsto 0.12 did the trick and we notice it found the points which surround the dense regions as noise (these will have a label of -1)
dbscan_labels_ = DBSCAN(min_samples=10, eps=0.12).fit_predict(X)
plt.title("Interleaved Moons w/ DBSCAN")
plt.xticks([])
plt.yticks([])

plt.scatter(X[:,0], X[:,1], c=dbscan_labels_, s=0.5)
HDBSCAN
HDBSCAN removes the need to specify a global epsilon neighborhood radius around each point (eps) and instead uses themin_pointsargument to create a radius to its k-th nearest neighbor, using the radius to push sparser regions further away from each other. Since HDBSCAN is built upon the agglomerative clustering technique single-linkage clustering, each point starts as its own cluster and is merged into a tree, bottom-up, until a single root cluster is reached. Amin_cluster_sizeargument allows us to specify a minimum threshold for when clusters in the agglomerated tree should be merged. The dendrogram is cut at varying levels, or selected, using a measure of cluster stability, based on the distances between the points in each cluster and the clusters from which they originated. Clusters which are selected cosume all of their descendent clusters. HDBSCAN provides an additional optioncluster_selection_epsilonto set the minimum distance threshold from which clusters will be split up into smaller clusters.
from cuml.cluster import HDBSCAN
labels_ = HDBSCAN(min_samples=10).fit_predict(X)
np.unique(labels_)
array([-1, 0, 1], dtype=int32)
plt.scatter(X[:,0], X[:,1], c=labels_, s=0.5)
Adding the same clustering against the reference Python HDBSCAN implementation
from hdbscan import HDBSCAN as HDBSCANref
labels_ = HDBSCANref(min_samples=25).fit_predict(X)
plt.scatter(X[:,0], X[:,1], c=labels_, s=0.5)
HDBSCAN 在实践中的应用
基于密度的聚类技术自然适合于许多不同的聚类任务,因为它们能够找到形状奇特、大小各异的聚类。与许多其他通用机器学习算法一样,没有免费的午餐,因此尽管 HDBSCAN 改进了一些成熟的算法,但它仍然不是完成这项工作的最佳工具。尽管如此, DBSCAN 和 HDBSCAN 在从地理空间和协同过滤/推荐系统到金融和科学计算等领域的应用中取得了显著的成功,被应用于从天文学到加速器物理学到基因组学等学科。它对噪声的鲁棒性也使得它对于异常值和异常检测应用非常有用。
与数据分析和机器学习生态系统中的许多其他工具一样,计算时间对生产系统和迭代工作流有很大的影响。更快的 HDBSCAN 意味着能够尝试更多的想法并制作更好的模型。下面是几个使用 HDBSCAN 对单词嵌入和单细胞 RNA 基因表达进行聚类的示例笔记本。这些都是为了简短,并为您自己的数据集使用 HDBSCAN 提供了一个很好的起点。您是否已成功地将 HDBSCAN 应用于工业或科学领域,我们在此未列出?请留下评论,因为我们很想听到。如果您在自己的硬件上运行示例笔记本电脑,还请告知我们您的设置以及您使用 RAPIDS 的经验。
单词嵌入
向量嵌入代表了一种流行且非常广泛的聚类机器学习应用。我们之所以选择 GoogleNews 数据集,是因为它足够大,可以很好地显示我们的算法的规模,但又足够小,可以在一台机器上执行。下面的笔记本演示了如何使用 HDBSCAN 查找有意义的主题,这些主题来自单词嵌入的角度空间中的高密度区域,并使用 UMAP 可视化生成的主题簇。它使用整个数据集的一个子集进行可视化,但为调整不同的超参数和熟悉它们对结果集群的影响提供了一个很好的演示。我们使用默认的超参数设置(形状为 3Mx300 )对整个数据集进行了基准测试,并在 24 小时后停止了 CPU 上的 Scikit learn contrib 实现。 RAPIDS 的实现大约需要 22 .8 分钟。
Clustering and Visualizing Embeddings with HDBSCAN & UMAP
In this notebook, we use a dataset of word embeddings to extract areas that could be associated with meaningful topics. We use HDBSCAN to find the meaningful topics since it can account for noise when labeling regions of high density without explicitly requiring a distance as input. We also use UMAP to visualize the resulting topic clusters.
This notebook requires theGoogleNews Word2Vec dataset, which can be downloaded fromhttps://drive.google.com/file/d/0B7XkCwpI5KDYNlNUTTlSS21pQmM/edit?usp=sharing.
from gensim import models
import cupy as cp

from cuml.manifold import UMAP
from cuml.preprocessing import normalize
from cuml.cluster import HDBSCAN

import matplotlib.pyplot as plt
from matplotlib.pyplot import figure
w = models.KeyedVectors.load_word2vec_format("GoogleNews-vectors-negative300.bin", binary=True)
We can usemin_samplesto control the radius of the core distances. A smaller setting leads to more clusters and less points being treated as noise.min_cluster_sizeandmax_cluster_sizebound the number of clusters by only allowing points to form a cluster when they are >min_cluster_clusterand splitting a single cluster into multiple smaller clusters when it is >max_cluster_size
n_points = 100000

umap_n_neighbors=100
umap_min_dist=1e-3
umap_spread=2.0
umap_n_epochs=500
umap_random_state=42

hdbscan_min_samples=25
hdbscan_min_cluster_size=5
hdbscan_max_cluster_size=1000
hdbscan_cluster_selection_method="leaf"
L2 normalize the vectors so that the Euclidean distance between them will give the angular distance.
%%time
X = normalize(cp.array(w.vectors))[:n_points]
CPU times: user 4.17 s, sys: 4.57 s, total: 8.73 s
Wall time: 8.76 s
X.shape
(100000, 300)
First, we can use manifold learning to convert the neighborhoods of points in the angular distance space to a 2-dimensional Euclidean space so that we can better virualize the clusters.
%%time
umap = UMAP(n_neighbors=umap_n_neighbors,
            min_dist=umap_min_dist,
            spread=umap_spread,
            n_epochs=umap_n_epochs,
            random_state=umap_random_state)

embeddings = umap.fit_transform(X)
CPU times: user 1.71 s, sys: 910 ms, total: 2.62 s
Wall time: 2.62 s
%%time
hdbscan = HDBSCAN(min_samples=hdbscan_min_samples,
                  min_cluster_size=hdbscan_min_cluster_size,
                  max_cluster_size=hdbscan_max_cluster_size,
                  cluster_selection_method=hdbscan_cluster_selection_method)

labels = hdbscan.fit_predict(X)
Label prop iterations: 23
Label prop iterations: 10
Label prop iterations: 6
Label prop iterations: 5
Iterations: 4
17663,114,1077,12,218,1603
CPU times: user 5.6 s, sys: 933 ms, total: 6.53 s
Wall time: 6.51 s
Percentage of points were labeled as meaningful topics
len(labels[labels!=-1]) / embeddings.shape[0]
0.04558
How many labels are there?
len(cp.unique(labels))
151
x = embeddings[:,0]
y = embeddings[:,1]

x = x[labels>-1]
y = y[labels>-1]

labels_nonoise = labels[labels>-1]

x_noise = embeddings[:,0]
y_noise = embeddings[:,1]

x_noise = x_noise[labels==-1]
y_noise = y_noise[labels==-1]
We observe that the regions of high density where points are collected closely together have filled out nicely into clusters of various different shapes and sizes. We interpret the distances of points within their local neighborhoods in the following plot as being more similar than points in disconnected neighborhoods. It's not uncommon for UMAP to split neighborhoods that into multiple clusters even though HDBSCAN labeled them as a single cluster. This just implies that the neighborhoods of the points which are split are more similar to each other internally than they are across their multiple separated components.
figure(figsize=(10, 7), dpi=80)
plt.scatter(x.get(), y.get(), c=labels_nonoise.get(), s=0.1, cmap='gist_ncar')
We can also visualize the noise
figure(figsize=(10, 7), dpi=80)
plt.scatter(x_noise.get(), y_noise.get(), s=0.001, cmap="gray", alpha=0.4)
label_dist = cp.histogram(labels, bins=cp.unique(labels))
plt.plot(label_dist[1][:len(label_dist[0])-1].get(), label_dist[0][1:].get())
[]
Let's look at a few groups of terms that clustered together
for c in range(0, 10):
    print("Cluster: %s, %s" % (c, [w.index_to_key[i] for i in cp.argwhere(labels==c)[:10,0].get()]))
Cluster: 0, ['##th', 'fourth', 'fifth', 'sixth', 'seventh', 'eighth', 'ninth', '###th', '##st', '##nd']
Cluster: 1, ['miles', 'north', 'south', 'west', 'east', 'kilometers', 'km', 'northwest', 'northeast', 'southwest']
Cluster: 2, ['petitioner', 'Defendant', 'Plaintiff', 'Appellant', 'Petitioner', 'appellants', 'Id.']
Cluster: 3, ['memorial', 'cemetery', 'burial', 'graves', 'remembrance']
Cluster: 4, ['FPL', 'AEP', 'Progress_Energy', 'TXU', 'FirstEnergy', 'Ameren', 'ComEd', 'NIPSCO']
Cluster: 5, ['Officials', 'Students', 'Residents', 'Customers', 'Businesses', 'Activists']
Cluster: 6, ['gay', 'gay_marriage', 'gays', 'lesbian', 'homosexual', 'LGBT', 'lesbians', 'homosexuals']
Cluster: 7, ['borrowings', 'Common_Stock', 'Common_Shares', 'Senior_Notes', 'senior_unsecured', 'debentures', 'convertible_notes', 'Preferred_Stock', 'Debentures', 'convertible_debentures']
Cluster: 8, ['-#.#', '-1', '-2', '-3', '-4']
Cluster: 9, ['Supreme_Court', 'justices', 'Alito', 'appellate_court', 'Samuel_Alito']
We can also order them according to their probabilities (notice most probabilities are fairly large because the regions are already pretty dense)
for c in range(0, 25):
    indices = list(cp.argwhere(labels==c).get()[:,0])
    sorted(indices, key=lambda x: 1 - hdbscan.probabilities_[x])
    print("Cluster: %s, %s" % (c, [w.index_to_key[i] for i in indices[:10]]))
Cluster: 0, ['##th', 'fourth', 'fifth', 'sixth', 'seventh', 'eighth', 'ninth', '###th', '##st', '##nd']
Cluster: 1, ['miles', 'north', 'south', 'west', 'east', 'kilometers', 'km', 'northwest', 'northeast', 'southwest']
Cluster: 2, ['petitioner', 'Defendant', 'Plaintiff', 'Appellant', 'Petitioner', 'appellants', 'Id.']
Cluster: 3, ['memorial', 'cemetery', 'burial', 'graves', 'remembrance']
Cluster: 4, ['FPL', 'AEP', 'Progress_Energy', 'TXU', 'FirstEnergy', 'Ameren', 'ComEd', 'NIPSCO']
Cluster: 5, ['Officials', 'Students', 'Residents', 'Customers', 'Businesses', 'Activists']
Cluster: 6, ['gay', 'gay_marriage', 'gays', 'lesbian', 'homosexual', 'LGBT', 'lesbians', 'homosexuals']
Cluster: 7, ['borrowings', 'Common_Stock', 'Common_Shares', 'Senior_Notes', 'senior_unsecured', 'debentures', 'convertible_notes', 'Preferred_Stock', 'Debentures', 'convertible_debentures']
Cluster: 8, ['-#.#', '-1', '-2', '-3', '-4']
Cluster: 9, ['Supreme_Court', 'justices', 'Alito', 'appellate_court', 'Samuel_Alito']
Cluster: 10, ['Citigroup', 'Goldman_Sachs', 'Morgan_Stanley', 'UBS', 'Merrill_Lynch', 'Deutsche_Bank', 'HSBC', 'Credit_Suisse', 'JPMorgan', 'JP_Morgan']
Cluster: 11, ['CEO', 'chairman', 'vice_president', 'Director', 'Vice_President', 'managing_director', 'Executive_Director', 'Managing_Director', 'Senior_Vice', 'Executive_Vice']
Cluster: 12, ['Wal_Mart', 'Walmart', 'Kmart', 'Kroger', 'Costco', 'Nordstrom', 'JC_Penney']
Cluster: 13, ['drilling', 'mineralization', 'intersected', 'g_t_Au', 'drill_holes', 'g_t_gold', 'g_t', 'mineralized', 'molybdenum', 'gold_mineralization']
Cluster: 14, ['JB', 'JM', 'ML', 'JS', 'JL', 'JH']
Cluster: 15, ['Warner_Bros.', 'Lionsgate', 'DreamWorks', 'Paramount_Pictures', 'Sony_Pictures']
Cluster: 16, ['artist', 'painting', 'paintings', 'painter', 'sculptures', 'artworks', 'watercolors', 'Paintings', 'canvases']
Cluster: 17, ['loans', 'mortgage', 'lenders', 'mortgages', 'borrowers', 'foreclosures', 'subprime', 'mortgage_lenders']
Cluster: 18, ['plane', 'aircraft', 'planes', 'airplane', 'jets', 'Airbus_A###', 'aircrafts']
Cluster: 19, ['apartments', 'condo', 'condominium', 'condos', 'Apartments', 'condominiums', 'townhouse', 'townhomes', 'Condominiums', 'townhome']
Cluster: 20, ['fell', 'jumped', 'climbed', 'slipped', 'risen', 'surged', 'plunged', 'slid', 'soared', 'dipped']
Cluster: 21, ['school', 'students', 'teachers', 'elementary', 'Elementary', 'kindergarten', 'preschool', 'elementary_schools', 'eighth_grade', 'eighth_graders']
Cluster: 22, ['professor', 'Professor', 'scientist', 'researcher', 'Ph.D.', 'associate_professor', 'master_degree', 'PhD', 'assistant_professor', 'bachelor_degree']
Cluster: 23, ['gun', 'firearm', 'rifle', 'handgun', 'pistol', 'pistols', 'assault_rifle', '.##_caliber', '.##_caliber_handgun', 'gauge_shotgun']
Cluster: 24, ['#.####', 'yen', 'greenback', 'EUR_USD', 'downtrend', 'USD_JPY', '#.####/##', 'GBP_USD', 'EURUSD', 'Japanese_Yen']
单细胞 RNA
下面是一个基于扫描和俱乐部库中教程笔记本的工作流示例。本示例笔记本取自 RAPIDS 单单元示例存储库,其中还包含几个笔记本,演示了 RAPIDS 用于单细胞和三级分析。在 DGX-1 (英特尔 40 核至强 CPU + NVIDIA V100 GPU )上,我们发现 HDBSCAN (在 GPU 上是~ 1s ,而不是具有多个 CPU 线程的~ 29s )使用了包含~ 70k 肺细胞基因表达的数据集上的前 50 个主成分,加速了 29x 。
RAPIDS & Scanpy Single-Cell RNA-seq Workflow
Copyright (c) 2020, NVIDIA CORPORATION.
Licensed under the Apache License, Version 2.0 (the "License") you may not use this file except in compliance with the License. You may obtain a copy of the License at
http://www.apache.org/licenses/LICENSE-2.0
Unless required by applicable law or agreed to in writing, software distributed under the License is distributed on an "AS IS" BASIS, WITHOUT WARRANTIES OR CONDITIONS OF ANY KIND, either express or implied. See the License for the specific language governing permissions and limitations under the License.
This notebook demonstrates a single-cell RNA analysis workflow that begins with preprocessing a count matrix of size(n_gene, n_cell)and results in a visualization of the clustered cells for further analysis.
For demonstration purposes, we use a dataset of ~70,000 human lung cells from Travaglini et al. 2020 (https://www.biorxiv.org/content/10.1101/742320v2) and label cells using the ACE2 and TMPRSS2 genes. See the README for instructions to download this dataset.
Import requirements
import numpy as np
import scanpy as sc
import anndata

import time
import os

import cudf
import cupy as cp

from cuml.decomposition import PCA
from cuml.manifold import TSNE
from cuml.cluster import KMeans

import rapids_scanpy_funcs

import warnings
warnings.filterwarnings('ignore', 'Expected ')
warnings.simplefilter('ignore')
We use the RAPIDS memory manager on the GPU to control how memory is allocated.
import rmm

rmm.reinitialize(
    managed_memory=True, # Allows oversubscription
    pool_allocator=False, # default is False
    devices=0, # GPU device IDs to register. By default registers only GPU 0.
)

cp.cuda.set_allocator(rmm.rmm_cupy_allocator)
Input data
In the cell below, we provide the path to the.h5adfile containing the count matrix to analyze. Please see the README for instructions on how to download the dataset we use here.
We recommend saving count matrices in the sparse .h5ad format as it is much faster to load than a dense CSV file. To run this notebook using your own dataset, please see the README for instructions to convert your own count matrix into this format. Then, replace the path in the cell below with the path to your generated.h5adfile.
input_file = "../data/krasnow_hlca_10x.sparse.h5ad"

if not os.path.exists(input_file):
    print('Downloading import file...')
    os.makedirs('../data', exist_ok=True)
    wget.download('https://rapids-single-cell-examples.s3.us-east-2.amazonaws.com/krasnow_hlca_10x.sparse.h5ad',
                  input_file)
Set parameters
# marker genes
RIBO_GENE_PREFIX = "RPS" # Prefix for ribosomal genes to regress out
markers = ["ACE2", "TMPRSS2", "EPCAM"] # Marker genes for visualization

# filtering cells
min_genes_per_cell = 200 # Filter out cells with fewer genes than this expressed
max_genes_per_cell = 6000 # Filter out cells with more genes than this expressed

# filtering genes
n_top_genes = 5000 # Number of highly variable genes to retain

# PCA
n_components = 50 # Number of principal components to compute

# t-SNE
tsne_n_pcs = 20 # Number of principal components to use for t-SNE

# k-means
k = 35 # Number of clusters for k-means

# KNN
n_neighbors = 15 # Number of nearest neighbors for KNN graph
knn_n_pcs = 50 # Number of principal components to use for finding nearest neighbors

# UMAP
umap_min_dist = 0.3
umap_spread = 1.0

# Gene ranking
ranking_n_top_genes = 50 # Number of differential genes to compute for each cluster
start = time.time()
Load and Prepare Data
We load the sparse count matrix from anh5adfile using Scanpy. The sparse count matrix will then be placed on the GPU.
data_load_start = time.time()
%%time
adata = sc.read(input_file)
CPU times: user 125 ms, sys: 228 ms, total: 354 ms
Wall time: 353 ms
adata.X.shape
(65662, 26485)
a = np.diff(adata.X.indptr)
a
array([1347, 1713, 1185, ..., 651, 1050, 2218], dtype=int32)
len(a[a<3000])
52985
We maintain the index of unique genes in our dataset:
%%time
genes = cudf.Series(adata.var_names)
sparse_gpu_array = cp.sparse.csr_matrix(adata.X)
CPU times: user 836 ms, sys: 586 ms, total: 1.42 s
Wall time: 1.45 s
Verify the shape of the resulting sparse matrix:
sparse_gpu_array.shape
(65662, 26485)
And the number of non-zero values in the matrix:
sparse_gpu_array.nnz
126510394
data_load_time = time.time()
print("Total data load and format time: %s" % (data_load_time-data_load_start))
Total data load and format time: 1.8720729351043701
Preprocessing
preprocess_start = time.time()
Filter
We filter the count matrix to remove cells with an extreme number of genes expressed.
%%time
sparse_gpu_array = rapids_scanpy_funcs.filter_cells(sparse_gpu_array, min_genes=min_genes_per_cell, max_genes=max_genes_per_cell)
CPU times: user 535 ms, sys: 304 ms, total: 839 ms
Wall time: 838 ms
Some genes will now have zero expression in all cells. We filter out such genes.
%%time
sparse_gpu_array, genes = rapids_scanpy_funcs.filter_genes(sparse_gpu_array, genes, min_cells=1)
CPU times: user 1.03 s, sys: 162 ms, total: 1.19 s
Wall time: 1.19 s
The size of our count matrix is now reduced.
sparse_gpu_array.shape
(65462, 22058)
Normalize
We normalize the count matrix so that the total counts in each cell sum to 1e4.
%%time
sparse_gpu_array = rapids_scanpy_funcs.normalize_total(sparse_gpu_array, target_sum=1e4)
CPU times: user 415 µs, sys: 599 µs, total: 1.01 ms
Wall time: 747 µs
Next, we log transform the count matrix.
%%time
sparse_gpu_array = sparse_gpu_array.log1p()
CPU times: user 42.7 ms, sys: 52.4 ms, total: 95.1 ms
Wall time: 94.4 ms
Select Most Variable Genes
We will now select the most variable genes in the dataset. However, we first save the 'raw' expression values of the ACE2 and TMPRSS2 genes to use for labeling cells afterward. We will also store the expression of an epithelial marker gene (EPCAM).
%%time
tmp_norm = sparse_gpu_array.tocsc()
marker_genes_raw = {
    ("%s_raw" % marker): tmp_norm[:, genes[genes == marker].index[0]].todense().ravel()
    for marker in markers
}

del tmp_norm
CPU times: user 208 ms, sys: 175 ms, total: 383 ms
Wall time: 383 ms
Now, we convert the count matrix to an annData object.
%%time
adata = anndata.AnnData(sparse_gpu_array.get())
adata.var_names = genes.to_pandas()
CPU times: user 178 ms, sys: 52.9 ms, total: 231 ms
Wall time: 229 ms
Using scanpy, we filter the count matrix to retain only the 5000 most variable genes.
%%time
sc.pp.highly_variable_genes(adata, n_top_genes=n_top_genes, flavor="cell_ranger")
adata = adata[:, adata.var.highly_variable]
CPU times: user 977 ms, sys: 26.5 ms, total: 1 s
Wall time: 1 s
Regress out confounding factors (number of counts, ribosomal gene expression)
We can now perform regression on the count matrix to correct for confounding factors - for example purposes, we use the number of counts and the expression of ribosomal genes. Many workflows use the expression of mitochondrial genes (named starting withMT-).
ribo_genes = adata.var_names.str.startswith(RIBO_GENE_PREFIX)
We now calculate the total counts and the percentage of ribosomal counts for each cell.
%%time
n_counts = adata.X.sum(axis=1)
percent_ribo = (adata.X[:,ribo_genes].sum(axis=1) / n_counts).ravel()

n_counts = cp.array(n_counts).ravel()
percent_ribo = cp.array(percent_ribo).ravel()
CPU times: user 881 ms, sys: 32.3 ms, total: 914 ms
Wall time: 913 ms
And perform regression:
%%time
sparse_gpu_array = cp.sparse.csc_matrix(adata.X)
CPU times: user 653 ms, sys: 114 ms, total: 767 ms
Wall time: 766 ms
%%time
sparse_gpu_array = rapids_scanpy_funcs.regress_out(sparse_gpu_array, n_counts, percent_ribo)
CPU times: user 31.8 s, sys: 10.5 s, total: 42.3 s
Wall time: 43.2 s
Scale
Finally, we scale the count matrix to obtain a z-score and apply a cutoff value of 10 standard deviations, obtaining the preprocessed count matrix.
%%time
sparse_gpu_array = rapids_scanpy_funcs.scale(sparse_gpu_array, max_value=10)
CPU times: user 119 ms, sys: 169 ms, total: 289 ms
Wall time: 287 ms
preprocess_time = time.time()
print("Total Preprocessing time: %s" % (preprocess_time-preprocess_start))
Total Preprocessing time: 48.95587778091431
Cluster & Visualize
We store the preprocessed count matrix as an AnnData object, which is currently in host memory. We also add the expression levels of the marker genes as observations to the annData object.
%%time

genes = adata.var_names
adata = anndata.AnnData(sparse_gpu_array.get())
adata.var_names = genes

for name, data in marker_genes_raw.items():
    adata.obs[name] = data.get()
CPU times: user 199 ms, sys: 92.1 ms, total: 292 ms
Wall time: 291 ms
Reduce
We use PCA to reduce the dimensionality of the matrix to its top 50 principal components.
%%time
adata.obsm["X_pca"] = PCA(n_components=n_components, output_type="numpy").fit_transform(adata.X)
CPU times: user 1.14 s, sys: 1.41 s, total: 2.55 s
Wall time: 2.55 s
UMAP + Density clustering
We can also visualize the cells using the UMAP algorithm in Rapids. Before UMAP, we need to construct a k-nearest neighbors graph in which each cell is connected to its nearest neighbors. This can be done conveniently using rapids functionality already integrated into Scanpy.
Note that Scanpy uses an approximation to the nearest neighbors on the CPU while the GPU version performs an exact search. While both methods are known to yield useful results, some differences in the resulting visualization and clusters can be observed.
%%time
sc.pp.neighbors(adata, n_neighbors=n_neighbors, n_pcs=knn_n_pcs, method='rapids')
CPU times: user 4.04 s, sys: 276 ms, total: 4.32 s
Wall time: 4.3 s
The UMAP function from Rapids is also integrated into Scanpy.
%%time
sc.tl.umap(adata, min_dist=umap_min_dist, spread=umap_spread, method='rapids')
WARNING: .obsp["connectivities"] have not been computed using umap
CPU times: user 246 ms, sys: 229 ms, total: 475 ms
Wall time: 474 ms
Next, we use the Louvain algorithm for graph-based clustering, once again using therapidsoption in Scanpy.
%%time
import pandas as pd
from cuml.cluster import HDBSCAN
hdbscan = HDBSCAN(min_samples=5, min_cluster_size=30)
adata.obs['hdbscan_gpu'] = pd.Categorical(pd.Series(hdbscan.fit_predict(adata.obsm['X_pca'])))
CPU times: user 718 ms, sys: 465 ms, total: 1.18 s
Wall time: 1.19 s
%%time
import pandas as pd
from hdbscan import HDBSCAN as refHDBSCAN
hdbscan = refHDBSCAN(min_samples=5, min_cluster_size=30, core_dist_n_jobs=-1)
adata.obs['hdbscan_cpu'] = pd.Categorical(pd.Series(hdbscan.fit_predict(adata.obsm['X_pca'])))
CPU times: user 23.5 s, sys: 1.2 s, total: 24.7 s
Wall time: 29.6 s
We plot the cells using the UMAP visualization, and using the Louvain clusters as labels.
%%time
sc.pl.umap(adata, color=["hdbscan_gpu"])
CPU times: user 597 ms, sys: 12.2 ms, total: 609 ms
Wall time: 607 ms
RAPIDS CUML 项目包括端到端 GPU 加速的 HDBSCAN ,并提供 Python 和 C ++ + API 。与 cuML 中的许多基于邻域的算法一样,它利用 Facebook 的费斯库中的蛮力 kNN 来加速相互可达空间中 kNN 图的构建。这是目前的一个主要瓶颈,我们正在研究通过精确和近似近邻选项进一步改进它的方法。
CUML 还包括单连锁层次聚类的实现,它提供了 C ++和 Python API 。 GPU – 加速单个链接算法需要计算最小生成树的新原语。此原语基于图形,因此可以在 cugraph 和 cuml 库中重用。我们的实现允许重新启动,这样我们就可以连接一个断开连接的 knn 图,并通过不必在 GPU 内存中存储整个成对距离矩阵来提高可伸缩性。
与大多数CUML算法中的C++一样,这些依赖于我们的大多数基于ML和基于图元的[VZX27 ]。最后,他们利用利兰·麦克因内斯和约翰·希利所做的伟大工作到 GPU ——甚至加快了群集压缩和选择步骤,使数据尽可能多地保留在 GPU 上,并在数据规模扩展到数百万时提供额外的性能提升。
基准
我们使用了 McInnes 等人在 CPU 上的参考实现提供的基准笔记本,将其与 cuML 的新 GPU 实现进行比较。参考实现针对低维情况进行了高度优化,我们将高维情况与大量使用 Facebook FAISS 库的暴力实现进行了比较。

图 4 : GPU – 加速 HDBSCAN 即使对于大型数据集也能保持近乎交互的性能,同时消除 CPU 有限的并行性。有了这些速度,你会发现你有更多的时间做其他事情,比如更好地了解你的数据。
基准测试是在 DGX-1 上执行的,该 DGX-1 包含 40 核 Intel 至强 CPU 和 NVIDIA 32gb V100 GPU s 。即使对维度数进行线性缩放,对行数进行二次缩放,我们观察到 GPU 仍然保持接近交互性能,即使行数超过 1M 。
发生了什么变化?
虽然我们已经成功地在 GPU 上实现了 HDBSCAN 算法的核心,但仍有机会进一步提高其性能,例如通过加快蛮力 kNN 图构造删除距离计算,甚至使用近似 kNN。虽然欧几里德距离涵盖了最广泛的用途,但我们还想公开Scikit 学习 Contrib 实现中提供的其他距离度量。
scikit learn contrib 实现还包含许多不错的附加功能,这些功能没有包含在 HDBSCAN 上的开创性论文中,例如半监督和模糊聚类。我们也有坚固的单连杆和光学算法的构建块,这将是 RAPIDS 未来的良好补充。最后,我们希望在将来支持稀疏输入。
如果您发现这些功能中的一个或多个可以使您的应用程序或数据分析项目更成功,即使此处未列出这些功能,请转到我们的Github 项目并创建一个问题。
概括
HDBSCAN 是一种相对较新的基于密度的聚类算法“站在巨人的肩膀上”,改进了著名的 DBSCAN 和光学算法。事实上,它的核心原语还增加了重用,并为其他算法提供了构建块,例如基于图的最小生成树和 RAPIDS ML 和图库中的单链接聚类。
与其他数据建模算法一样, HDBSCAN 并不是所有工作的完美工具,但它在工业和科学计算应用中都有很多实际用途。它还可以与 PCA 或 UMAP 等降维算法配合使用,尤其是在探索性数据分析应用中。
关于作者
Corey Nolet 是 NVIDIA 的 RAPIDS ML 团队的数据科学家兼高级工程师,他专注于构建和扩展机器学习算法,以支持光速下的极端数据负载。在 NVIDIA 工作之前, Corey 花了十多年时间为国防工业的 HPC 环境构建大规模探索性数据科学和实时分析平台。科里持有英国理工学士学位计算机科学硕士学位。他还在攻读博士学位。在同一学科中,主要研究图形和机器学习交叉点的算法加速。科里热衷于利用数据更好地了解世界。
Divye Gala 是 NVIDIA 的 RAPIDS 团队的高级软件工程师,在 GPU 上开发用于机器学习和图形分析的快速可扩展算法。 Divye 持有女士和 Bs 。计算机科学学位。在空闲时间,迪维喜欢踢足球和看板球。
审核编辑:郭婷
-
cpu
+关注
关注
68文章
10882浏览量
212245 -
gpu
+关注
关注
28文章
4754浏览量
129080 -
API
+关注
关注
2文章
1505浏览量
62185
发布评论请先 登录
相关推荐
GPU加速matlab程序
Nvidia宣布推出了一套新的开源RAPIDS库
NVIDIA RAPIDS加速器可将工作分配集群中各节点
如何使用RAPIDS和CuPy时加速Gauss 秩变换

NVIDIA RAPIDS加速器v21.08的功能应用
RAPIDS cuML中的输入输出可配置性

AutoML技术提高NVIDIA GPU和RAPIDS速度
RAPIDS cuDF将pandas提速近150倍


 具有RAPIDS cuML的GPU加速分层DBSCAN




评论