 如何使用Intel Processor Trace工具查看任意函数执行时间
在上一篇文章 PT_PERF: 基于 Intel PT 的时延性能分析工具 中,我们介绍了 Intel Processor Trace 时延分析工具的背景,功能和实现。
本篇文章我们主要介绍一下如何使用 PT_PERF 工具查看任意函数的执行时间,包括 on-cpu 和 off-cpu 的时间。
1 背景
时延是我们最直接判断一个函数执行效率的方式。我们最为习惯的是在编译前对程序埋点,但这费时费力,并且修改代码可能影响了程序的执行行为,造成统计误差。借助 eBPF 的 func_latency 工具和 dynamic instrumentation 技术,我们能够在不修改程序的情况下,统计函数时延,但通常工具的使能开销就是 2000 cpu cycles,并且在高频函数调用下,工具对程序性能的影响达到 50% 以上。
举个例子,我们对 MySQL 启动一个 32 线程的 sysbench oltp_read_only 只读负载,在 91 秒使用 eBPF 统计 1s 时间 MySQL innodb 中 'row_search_mvcc' 的函数时延。此时 MySQL 的 QPS 从 30 w 下降到了 7.8 w。
[90s]thds:32tps:19488.04qps:301753.61
[91s]thds:32tps:4912.97qps:78695.49#startebpfuprobe
[92s]thds:32tps:12584.17qps:201264.72
[93s]thds:32tps:19611.97qps:303792.55
ebpf 输出了函数时延的直方图信息,平时时延是 3153 纳秒,其中在 2048 纳秒到 4095 纳秒的时延调用了 971975 次。
但我们也能看到因使能开销对精度的影响, 统计结果1 us 以下的时延都为 0。
     nsecs               : count     distribution
       256 -> 511        : 0        |                                        |
       512 -> 1023       : 0        |                                        |
      1024 -> 2047       : 268363   |***********                             |
      2048 -> 4095       : 971975   |****************************************|
      4096 -> 8191       : 101768   |****                                    |
      8192 -> 16383      : 8389     |                                        |
     16384 -> 32767      : 86       |                                        |
     32768 -> 65535      : 13666    |                                        |
     65536 -> 131071     : 56       |                                        |
avg = 3153 nsecs, total: 4223229085 nsecs, count: 1339391
基于 Intel CPU 硬件指令 trace 流的方式,我们实现了更精确,对程序性能影响更小的时延性能分析工具。
2 PT_PERF 安装
在 Linux 4.2+ 和 GCC 7+ 版本下,可以通过下面命令安装 PT_PERF。
sudo yum install binutils binutils-devel elfutils-libelf-devel -y
git clone https://github.com/mysqlperformance/pt_perf.git
cd pt_perf
make
在使用之前我们需要配置一些系统参数,
修改 perf_event_mlock_kb 支持更大的 trace buffer,减少 trace 数据丢失。
修改 kptr_restrict 支持追踪内核函数,如追踪 off-cpu 分析需要的 schedule 内核函数。
echo131072>/proc/sys/kernel/perf_event_mlock_kb
echo0>/proc/sys/kernel/kptr_restrict
3 时延分析
我们用 PT_PERF 对相同 read_only 负载进行分
[90s]thds:32tps:19651.81qps:314423.96
[91s]thds:32tps:19418.84qps:310733.39#startptperftrace
[92s]thds:32tps:19221.36qps:307534.77
[93s]thds:32tps:19241.35qps:307857.54
在 91s 时对 'row_search_mvcc' 函数进行 trace,可以看到 qps 从 31w 下降到 30.7w,对性能影响较小。
pt_perf 的输出主要包括:
和 eBPF 类似的时延直方图,可以看到 ‘row_search_mvcc’ 的平均时延为 564 ns,以及在每个时延区间的调用次数,精度能精确到 10 ns。
off-cpu (被内核调度出去的时间) 的时延直方图,因为当前负载主要是 cpu 密集型,所以调度很少,只有 322 次 row_search_mvcc 被调度,off-cpu 时延在 564ns 的平均时延中占比为 0 ns,可以忽略不计。
row_search_mvcc 这个函数占用的 on-cpu 时间为 404%,约占用 4 个 cpu 核。
接下来是 row_search_mvcc 每个子函数调用次数,平均时延,以及 off-cpu,on-cpu 时间。可以看到两个占比较高的函数,一个是遍历 btree 的函数 btr_pcur_open_with_no_init_func ,以及存储查询到的数据行的函数 row_sel_store_mysql_rec。
sudo ./func_latency -b /disk2/bin/mysqld -f row_search_mvcc -d 1 -i -t -s -p `mysqlpid` -o


===========================================================================================================
Histogram - Latency of [row_search_mvcc]:
          ns             : cnt        distribution        sched      distribution
        32 -> 63         : 1003561  |****                | 0        |                    |
        64 -> 127        : 4231126  |********************| 0        |                    |
       128 -> 255        : 3443046  |****************    | 0        |                    |
       256 -> 511        : 879947   |****                | 0        |                    |
       512 -> 1023       : 41407    |                    | 0        |                    |
      1024 -> 2047       : 1472     |                    | 0        |                    |
      2048 -> 4095       : 148607   |                    | 3        |                    |
      4096 -> 8191       : 86048    |                    | 121      |********************|
      8192 -> 16383      : 9781     |                    | 88       |**************      |
     16384 -> 32767      : 54725    |                    | 105      |*****************   |
     32768 -> 65535      : 44435    |                    | 4        |                    |
     65536 -> 131071     : 619      |                    | 0        |                    |
    131072 -> 262143     : 3        |                    | 1        |                    |
trace count: 9944777, average latency: 564 ns
sched count:     322,   sched latency:   0 ns, cpu percent: 404 %
sched total: 268506, sched each time: 16 ns


-----------------------------------------------------------------------------------------------------------
Histogram - Child functions's Latency of [row_search_mvcc]:
                    name                 : avg        cnt        sched_time cpu_pct(%) distribution (total)
__irqentry_text_start                    : 14141      4167       159        4.20      |*                   |
asm_sysvec_reschedule_ipi                : 10580      24         8586       0.00      |                    |
asm_exc_nmi                              : 9363       76         0          0.05      |                    |
asm_sysvec_call_function_single          : 7702       35         5517       0.01      |                    |
asm_sysvec_apic_timer_interrupt          : 7488       1370       41         0.74      |                    |
btr_pcur_open_with_no_init_func          : 2014       337908     1          49.02     |*****************   |
asm_sysvec_call_function                 : 1515       98         0          0.01      |                    |
asm_sysvec_irq_work                      : 1447       72         0          0.01      |                    |
ut_new_get_key_by_file                   : 784        3910       2          0.22      |                    |
sel_restore_position_for_mysql           : 699        944        0          0.05      |                    |
btr_pcur_store_position                  : 227        243264     0          3.98      |*                   |
trx_assign_read_view                     : 226        337908     0          5.52      |*                   |
mtr_t::commit                            : 168        338855     0          4.11      |*                   |
ut_allocator::allocate    : 156        3910       0          0.04      |                    |
row_sel_store_mysql_rec                  : 80         9947703    0          57.48     |********************|
free                                     : 74         3910       0          0.02      |                    |
que_thr_move_to_run_state_for_mysql      : 59         338852     0          1.46      |                    |
trx_start_if_not_started_low             : 58         338852     0          1.43      |                    |
row_sel_dequeue_cached_row_for_mysql     : 58         9510339    0          40.26     |**************      |
cmp_dtuple_rec                           : 57         482732     0          1.99      |                    |
rec_get_offsets_func                     : 47         10189058   0          34.63     |************        |
mtr_t::start                             : 47         338852     0          1.17      |                    |
ReadView_guard::bind_snapshot            : 45         338852     0          1.10      |                    |
row_search_end_range_check               : 40         9706318    0          28.31     |*********           |
pfs_memory_free_v1                       : 37         3910       0          0.01      |                    |
row_prebuilt_t::can_prefetch_records     : 29         241376     0          0.52      |                    |
lock_clust_rec_cons_read_sees            : 25         9943793    0          18.01     |******              |
que_thr_stop_for_mysql_no_error          : 22         338855     0          0.55      |                    |
btr_pcur_move_to_next                    : 18         10120567   0          13.52     |****                |
mtr_t::~Impl                       : 9          9944782    0          6.66      |**                  |
ReadView_guard::~ReadView_guard          : 8          9944782    0          6.16      |**                  |
trx_is_interrupted                       : 7          10457511   0          5.31      |*                   |
ReadView_guard::ReadView_guard           : 6          9944777    0          4.32      |*                   |
row_sel_fetch_last_buf                   : 6          9605884    0          4.76      |*                   |
lob::reset                  : 4          20402293   0          6.46      |**                  |
row_sel_enqueue_cache_row_for_mysql      : 3          9510294    0          2.64      |                    |
row_sel_get_record_buffer                : 2          9944777    0          2.06      |                    |
除此之外,PT_PERF 还分别输出了从不同函数调用 row_search_mvcc 函数的时延,其中从 index_read 中调用的 row_search_mvcc 时延达到了 12us,这是 mysql 从 root 节点遍历 btree 的函数。从 general_fetch 中调用的 row_search_mvcc 时延为 154 ns,因为这大部分是从 record 缓存中取数据,时间很短。
===========================================================================================================
Histogram - Latency of [row_search_mvcc]
           called from [ha_innobase::index_read]:
          ns             : cnt        distribution        sched      distribution
      2048 -> 4095       : 148424   |********************| 0        |                    |
      4096 -> 8191       : 84834    |***********         | 73       |*****************   |
      8192 -> 16383      : 6273     |                    | 69       |****************    |
     16384 -> 32767      : 53379    |*******             | 82       |********************|
     32768 -> 65535      : 44376    |*****               | 4        |                    |
     65536 -> 131071     : 619      |                    | 0        |                    |
    131072 -> 262143     : 3        |                    | 1        |                    |
trace count: 337908, average latency: 12222 ns
sched count:    229,   sched latency:     9 ns, cpu percent: 297 %


...


===========================================================================================================
Histogram - Latency of [row_search_mvcc]
           called from [ha_innobase::general_fetch]:
          ns             : cnt        distribution        sched      distribution
        32 -> 63         : 1003561  |****                | 0        |                    |
        64 -> 127        : 4231126  |********************| 0        |                    |
       128 -> 255        : 3443046  |****************    | 0        |                    |
       256 -> 511        : 879947   |****                | 0        |                    |
       512 -> 1023       : 41407    |                    | 0        |                    |
      1024 -> 2047       : 1472     |                    | 0        |                    |
      2048 -> 4095       : 183      |                    | 3        |*                   |
      4096 -> 8191       : 1214     |                    | 48       |********************|
      8192 -> 16383      : 3508     |                    | 19       |*******             |
     16384 -> 32767      : 1346     |                    | 23       |*********           |
     32768 -> 65535      : 59       |                    | 0        |                    |
trace count: 9606869, average latency: 154 ns
sched count:      93,   sched latency:   0 ns, cpu percent: 106 %


...
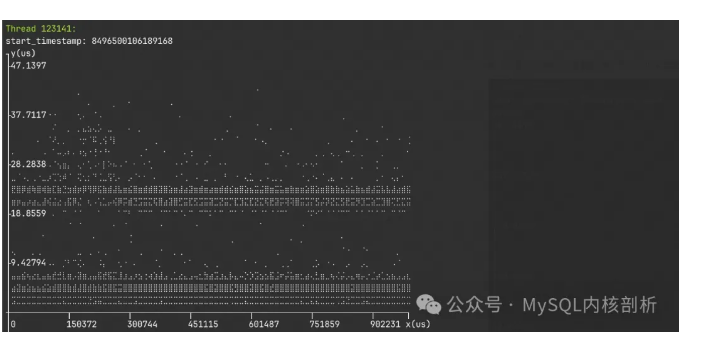
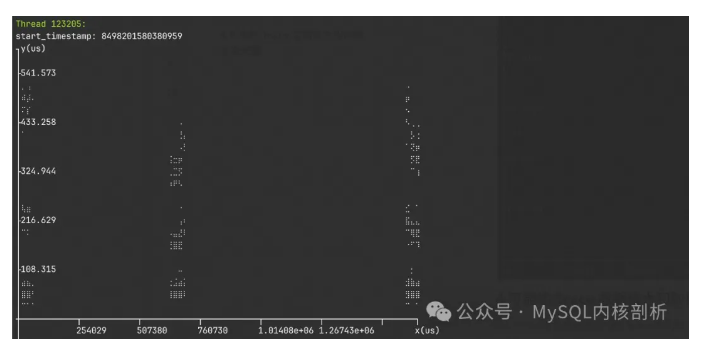
通过指定 -l,也能看到随采样时间的时延散点图,用于排查异常的时延点,找到异常时间点的时间范围,横坐标是从 trace 开始到 trace 结束的时间,纵坐标是时延。
通过 --srcline,也可以看到每个函数的地址,源文件位置以及行号,存在多个相同子函数时,方便快速定位。
Histogram - Child functions's Latency of [row_search_mvcc(row0sel.cc:4292)]:
                    name                 : avg        cnt        src_line           distribution (total)
btr_pcur_open_with_no_init_func(34b90d0) : 1777       583484     btr0pcur.ic:417   |*****************   |
ut_new_get_key_by_file(3058340)          : 664        6809       ut0new.h:458      |                    |
sel_restore_position_for_mysql(34b958b)  : 597        1728       row0sel.cc:3403   |                    |
btr_pcur_store_position(303ace0)         : 206        420243     btr0pcur.cc:95    |*                   |
trx_assign_read_view(357f910)            : 205        583484     trx0trx.cc:2549   |**                  |
mtr_t::commit(33d3910)                   : 146        585216     mtr0mtr.cc:900    |*                   |
ut_allocator::allocate(2f : 129        6809       ut0new.h:617      |                    |
row_sel_store_mysql_rec(34bea10)         : 68         17171737   row0sel.cc:2958   |********************|
有了 off-cpu 时间的指标,我们也能够直观地看到因资源等待的一些瓶颈,如我们分别在同一台机器和不同机器来压测 MySQL 实例,可以看到 get_command 获取 SQL 指令的开销是不同的。远端发压的 get_command 时间高出本机发压 30us,主要都是调度出去等待网络包的时间,因此实际执行 SQL 的 dispatch_command CPU 开销占比也有所差别。
# 本机发压
-----------------------------------------------------------------------------------------------------------
Histogram - Child functions's Latency of [do_command]:
                    name                 : avg        cnt        sched_time cpu_pct(%) distribution (total)
dispatch_command                         : 82752      333059     2          2743.12   |********************|
Protocol_classic::get_command            : 13106      333054     7682       179.79    |***                 |


# 远端发压
-----------------------------------------------------------------------------------------------------------
Histogram - Child functions's Latency of [do_command]:
                    name                 : avg        cnt        sched_time cpu_pct(%) distribution (total)
dispatch_command                         : 78660      263266     100        2058.90   |********************|
Protocol_classic::get_command            : 42541      263256     36322      162.97    |**********          |
4 Trace 数据量大和数据丢失问题
CPU 的指令执行是很快的,trace 得到的指令流也是巨大的。使用硬件 trace 来分析性能的最关键问题是:如何快速处理庞大的指令流,以及应对 trace 丢失问题。
在 Linux 5.10 之前的 Perf tool 版本不支持 Ip_filtering,PT_PERF 在 trace 阶段,需要采样全量指令,再解析时来统计目标函数的时延。
举个例子来说明 trace 的数据量和丢失现象。
在 Intel(R) Xeon(R) Platinum 8163 包含 96 核 CPU 的机器上,使用 sysbench oltp_read_only 32 并发的压力,输出 PT_PERF 的中间结果,可以看到,指定采集 mysql 进程一秒,得到了 3G 的原始的指令流(perf.data),如果将全量指令跳转解析将得到 122 GB 的解析文件,启动 10 个并发 worker 来解析,需要 500 秒的解析时间。即使只解析目标函数跳转得到较小的解析文件,也需要花费 110 秒的时间,目前因为 intel-pt 的格式原因,遍历指令流的开销是无法避免的。
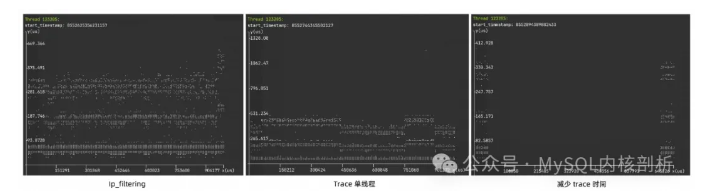
并且在 trace 过程中遇到了 45 次数据丢失,虽然指定了 1s 的 trace 时间,但实际的 trace 时间跨度为 1.75s,其中丢失了 1.25s 的 trace 时间。通过数据丢失的日志我们可以丢弃不完整的函数调用,但难以对异常点的排查,从生成的散点图我们也能看到的 trace 数据的丢失程度。
sudo ./func_latency -b /disk2/bin/mysqld -f do_command -d 1 -s -p `mysqlpid` -o -w 10 -l -t
[ trace process 121576 for 1.00 seconds ]
[ perf record: Woken up 0 times to write data ]
[ perf record: Captured and wrote 3047.905 MB perf.data ]
[ perf record has consumed 11.75 seconds ]
[ start 10 parallel workers ]
[ perf script has consumed 110.87 seconds ]
[ parse actions has consumed 4.18 seconds ]
[ parsed 1554137 actions, trace errors: 459 ]
[ analyze functions has consumed 0.19 seconds ]
[ real trace time: 1.75 seconds ]
[ miss trace time: 1.25 seconds ]
实际上 trace 量和数据丢失的程度也和程序的压力息息相关,压力不大,trace 数据量和数据丢失都不会很严重。
但为了减少 trace 数据量带来的解析过慢,以及数据丢失带来的影响,我们可以:
5.10 版本以上可以使用 ip_filtering (-i),只 trace 目标函数跳转的指令流。
只 trace 单个,或部分线程的指令流。
减少 trace 的时间,但无法避免 trace 数据的丢失,实际上 trace 时间需要考虑 PT 使能的时间(考虑到所有线程 event open 和 buffer 映射的时间)。
当然,也可以同时考虑这些方式来减少 trace 数据量。我们分别来看每种方式的 trace 时间,以及数据丢失程度。
从解析时间和 trace errors 可以看到,使用 Ip_filtering 和 trace 单个线程都能很好减少 trace 的数据量,数据基本没有丢失。减少 trace 时间也能够降低部分解析时间,压力较大时,但要考虑 trace 的线程数目,虽然只 trace 0.01s,但实际 trace 了 0.82s。从散点图我们也能看到每种方式的数据丢失程度。
# Ip_filtering
sudo ./func_latency -b /disk2/bin/mysqld -f do_command -d 1 -s -p `mysqlpid` -t -i -o -l
[ trace process 121576 for 1.00 seconds ]
[ perf record: Woken up 0 times to write data ]
[ perf record: Captured and wrote 603.105 MB perf.data ]
[ perf record has consumed 10.64 seconds ]
[ start 10 parallel workers ]
[ perf script has consumed 6.94 seconds ]
[ parse actions has consumed 2.82 seconds ]
[ parsed 7737348 actions, trace errors: 0 ]
[ analyze functions has consumed 1.16 seconds ]
[ real trace time: 1.00 seconds ]
[ miss trace time: 0.00 seconds ]


# trace 单个线程
sudo ./func_latency -b /disk2/bin/mysqld -f do_command -d 1 -s -T 123205 -t -o -l
[ trace thread 123205 for 1.00 seconds ]
[ perf record: Woken up 63 times to write data ]
[ perf record: Captured and wrote 503.424 MB perf.data ]
[ perf record has consumed 3.21 seconds ]
[ start 10 parallel workers ]
[ perf script has consumed 13.94 seconds ]
[ parse actions has consumed 0.08 seconds ]
[ parsed 184278 actions, trace errors: 0 ]
[ analyze functions has consumed 0.12 seconds ]
[ real trace time: 1.00 seconds ]
[ miss trace time: 0.00 seconds ]


# trace 0.1s
sudo ./func_latency -b /disk2/bin/mysqld -f do_command -d 0.01 -s -p `mysqlpid` -t -o -l
[ trace process 121576 for 0.01 seconds ]
[ perf record: Woken up 0 times to write data ]
[ perf record: Captured and wrote 1946.374 MB perf.data ]
[ perf record has consumed 10.65 seconds ]
[ start 10 parallel workers ]
[ perf script has consumed 74.54 seconds ]
[ parse actions has consumed 3.72 seconds ]
[ parsed 913309 actions, trace errors: 357 ]
[ analyze functions has consumed 0.11 seconds ]
[ real trace time: 0.82 seconds ]
[ miss trace time: 0.31 seconds ]
-
intel
+关注
关注
19文章
3482浏览量
186018 -
函数
+关注
关注
3文章
4332浏览量
62638 -
MySQL
+关注
关注
1文章
812浏览量
26585 -
线程
+关注
关注
0文章
505浏览量
19689
原文标题:如何使用 Intel Processor Trace 工具查看任意函数执行时间
文章出处:【微信号:inf_storage,微信公众号:数据库和存储】欢迎添加关注!文章转载请注明出处。
发布评论请先 登录
相关推荐
如何使用STM模块测量函数的执行时间?
【安富莱——DSP教程】第42章 DSP库函数执行时间测试
嵌套循环执行时间计算
如何在microblaze上测量C代码的执行时间?
如何使用CYCLECOUNTER快速的测量执行时间?
如何在MCU上测量代码执行时间?
RTThread Studio该如何查看代码执行时间
STCU在线BIST总执行时间是多少?
如何测量ARM Cortex-M MCU代码的执行时间
STM32F407+CubeMX - 使用GPIO翻转+示波器测量函数的执行时间

TPT19新特性之最坏情况执行时间的指示

Python 优化—算出每条语句执行时间


 工商网监
工商网监
评论