Abstract: This application note describes how to use the Keil µVision2 suite of tools to debug an application for the Ultra-High-Speed Flash family of microcontrollers, which includes the DS89C430 and DS89C450. This process involves loading a debug monitor application into the microcontroller which communicates with Keil µVision2 over a selected serial port.
These files are available at http://www.maxim-ic.com/products/microcontrollers/software/index.cfm under "Application Note Software". The names given above are for the originally released versions; any later updates will be "v15", "v16" and so on.
Before loading the selected debugging monitor on the DS89C450 Evaluation Kit board, set the board up as follows:
To load the debugging monitor:

Figure 1. Loading the debug monitor using the microcontroller tool kit.
The Select Device for Target dialog will appear as shown below in Figure 2. Under Database, select Dallas Semiconductor and the particular microcontroller you are using (the DS89C430, DS89C440, or DS89C450). Hit OK to continue.

Figure 2. Selecting the device for a new Keil µVision2 Project.
A new dialog box will ask, "Copy 8051 Startup Code to Project Folder and Add File to Project?" Select YES.
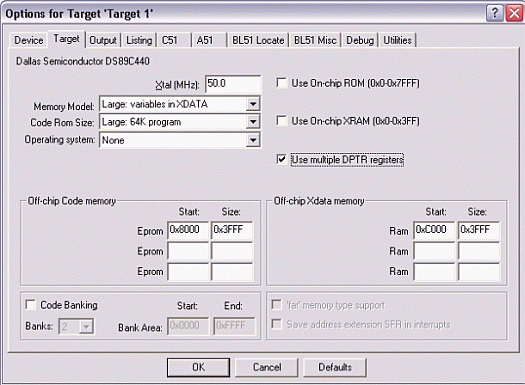
Select the Target tab. Change the settings in this tab as follows:
Figure 3. Target option settings for the DS89C430/440/450.
Next, select the Debug tab, and set the options as follows (shown in Figure 4 below).
Figure 4. Debug option settings for the DS89C430/440/450.

Figure 5. Compilation output from Keil µVision.

Figure 6. Debugging output from Keil µVision.
Overview
All development for this application note was done using the DS89C440 and the DS89C450 Evaluation Kit Board (Rev B). The C application was created and compiled using Keil's µVision2 version 2.40 and the Keil C51 Compiler version 7.10. The debug monitor was loaded into the DS89C440 flash memory using the Microcontroller Tool Kit version 2.1.03.Installing the Keil Debugging Monitor
There are two different versions of the Keil debugging monitor available for the DS89C4X0, depending on which serial port will be used to communicate with Keil µVision2 on the host PC. This serial port will be unavailable for use by the application under debug.| Serial Port Used | Timer Used | Crystal Speed | Monitor File Name |
| Serial Port 0 | Timer 1 | 16.384 MHz | mon4x0_v14_s0.hex |
| Serial Port 1 | Timer 1 | 16.384 MHz | mon4x0_v14_s1.hex |
These files are available at http://www.maxim-ic.com/products/microcontrollers/software/index.cfm under "Application Note Software". The names given above are for the originally released versions; any later updates will be "v15", "v16" and so on.
Before loading the selected debugging monitor on the DS89C450 Evaluation Kit board, set the board up as follows:
- A 6-9 volt DC power supply (center post positive) should be connected to power plug J1.
- A straight-through, DB9 serial cable should be connected from J2 (SERIAL 0/LOADER) to COM1 on the PC.
- A 16.384 MHz crystal should be inserted at Y1.
- DIP switches SW1.1-7 and SW4.1-2 should be ON. All other DIP switches should be OFF.
To load the debugging monitor:
- Open MTK. In the microcontroller type dialog, select DS89C430, DS89C440, or DS89C450 depending on the processor type you have inserted in the DIP-40 socket on the kit board.
- Turn power on to the DS89C450 Evaluation Kit Board.
- Select Options -> Configure Serial Port. Set the serial port options to COM1 and 14400 baud.
- Select Target -> Open COM1 at 14400 baud.
- Select Target -> Connect to Loader.
- A loader prompt should appear (DS89C4X0 LOADER VERSION...)
- At the loader prompt, type "K" and press ENTER to erase the microcontroller flash memory.
- Select File -> Load from the menu. Select the debug monitor file that you wish to use.
- Once loading completes, select Target -> Close COM1 and close Microcontroller Tool Kit.
- Turn power off to the DS89C450 Evaluation Kit Board.
- Set DIP switch SW4.1 to the OFF position.

Figure 1. Loading the debug monitor using the microcontroller tool kit.
Creating and Compiling the C Application
This section describes the process to create and compile a sample C application for the DS89C430/440/450 using Keil's µVision2 integrated development environment.Creating a New Project
In Keil µVision2, select Project -> Create New Project from the menu. Enter the name of your new project.The Select Device for Target dialog will appear as shown below in Figure 2. Under Database, select Dallas Semiconductor and the particular microcontroller you are using (the DS89C430, DS89C440, or DS89C450). Hit OK to continue.

Figure 2. Selecting the device for a new Keil µVision2 Project.
A new dialog box will ask, "Copy 8051 Startup Code to Project Folder and Add File to Project?" Select YES.
Setting Project Options
When the project window opens on the left, open up Target 1. Right click on Target 1, and select Options for Target 'Target 1'. An Option dialog box will appear.Select the Target tab. Change the settings in this tab as follows:
- Memory Model - Set to Large: Variables in XDATA. This tells the compiler to locate variables in external MOVX RAM. This is appropriate when using a hardware setup, such as the High-Speed Microcontroller Evaluation Kit, which provides external data memory for the DS89C430/440/450.
- Code ROM Size - Set to Large: 64K program.
- Set the checkbox for Use multiple DPTR registers.
- In the Off-chip Code Memory section of the dialog, set the top two fields to Eprom Start: 0x8000 and Eprom Size: 0x3FFF.
- In the Off-chip Xdata Memory section of the dialog, set the top two fields to Ram Start: 0xC000 and Ram Size: 0x3FFF.

Figure 3. Target option settings for the DS89C430/440/450.
Next, select the Debug tab, and set the options as follows (shown in Figure 4 below).
- Select Use and Keil Monitor-51 Driver
- Set the checkboxes for Load Application at Startup and Go till main().
- Click the Settings button and select COM1 and 14400 Baud.

Figure 4. Debug option settings for the DS89C430/440/450.
Adding the Project Code
Open a new file and enter the following C code:#includeSave this file as main.c. The file will not be automatically added to the project. To add the file, right-click on Source Group 1 and select Add Files to Group 'Source Group 1'. Select main.c and click Add, then click Close.#include main() { int x = 1; while (1) { x++; } }
Compiling and Loading the Project
To compile the project, press F7, or select Project -> Build Target from the menu. If no errors occur, messages should appear indicating that compilation completed successfully, as shown in Figure 5.
Figure 5. Compilation output from Keil µVision.
Debugging the Project
Before starting the debugging session in Keil µVision2, power on the DS89C450 Evaluation Kit Board and verify that the serial cable is connected as follows:- If you are using the Serial 0 version of the debugging monitor, the serial cable should be connected from COM1 to the J2 / SERIAL 0 connector on the kit board.
- If you are using the Serial 1 version of the debugging monitor, the serial cable should be connected from COM1 to the J3 / SERIAL 1 connector on the kit board.

Figure 6. Debugging output from Keil µVision.
Debug Monitor Limitations for the DS89C4X0
The debugging monitors for the DS89C430, DS89C440 and DS89C450 have the following limitations:- All flash memory, and all external MOVX memory below 8000h, is reserved for use by the debug monitor.
- The following registers/bits are reserved when using either version of the monitor.
- (Timer 1) TCON.0-1, TCON.6-7, TMOD.4-7, TL1, TH1, CKCON.4, CKMOD.4
- (General) EXIF.1-2, ACON, ROMSIZE, PMR, WDCON
- The following registers/bits are reserved when using the Serial 0 version of the monitor.
- P3.0-1, PCON.6-7, SCON0, SBUF0
- The following registers/bits are reserved when using the Serial 1 version of the monitor.
- P1.2-3, SCON1, SBUF1
- Interrupts will be redirected to the appropriate vector plus 8000h. For example, external interrupt 0 will vector to address 8003h.
- In some configurations, Keil µVision2 may lose contact with the debug monitor when executing a Go operation for more than a few seconds. If this occurs, debug your application by tracing through code or by running from breakpoint to breakpoint.
 电子发烧友App


评论